
Introduction
Streaming platforms are no longer competing only on content volume; they are competing on relevance, timing, and viewer engagement depth. As the OTT market becomes saturated, understanding why certain platforms retain viewers longer has shifted from intuition to evidence-driven analysis. Modern platforms now rely on structured datasets that reveal what truly drives watch-time, repeat visits, and content loyalty across regions and demographics.
This shift has brought OTT Competitor Analysis Using Data Scraping into the spotlight as a performance intelligence tool. By tracking real-time catalog updates, content positioning, release frequency, and audience response patterns, OTT brands can align programming strategies with actual viewer behavior rather than assumptions.
With Best OTT App Scraping, platforms can study how competitors deploy seasonal launches, exclusive originals, and localized content strategies. Instead of reacting late to market changes, data-driven teams proactively adjust acquisition and retention strategies. As viewer expectations evolve faster than ever, scraping-powered analysis is becoming the backbone of OTT decision-making, enabling platforms to optimize content investments and sustain long-term engagement growth.
Shifting Viewer Interest Patterns Through Streaming Trends
Viewer engagement increasingly depends on how well platforms adapt to evolving audience preferences. Streaming services that consistently monitor content cycles and refresh their offerings tend to maintain stronger viewer interest over extended periods. Data-driven observation shows that timely releases, curated collections, and promotional positioning directly influence watch duration and return frequency.
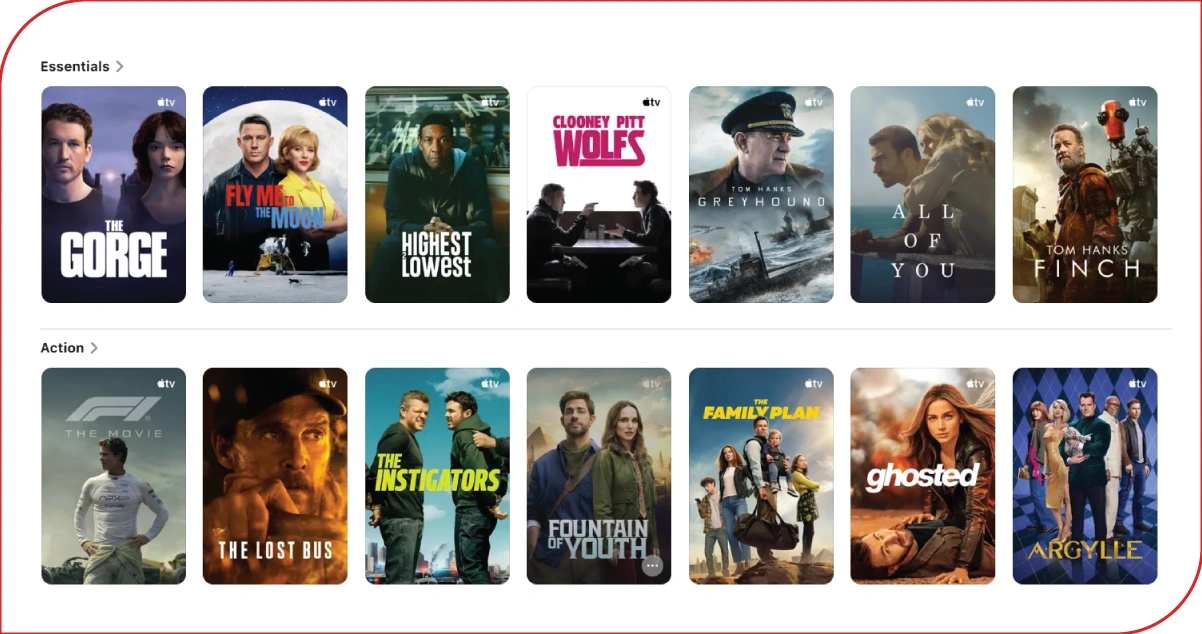
By applying techniques to Scrape Apple TV Movie Streaming Data, platforms can observe how release timing, exclusive premieres, and thematic collections impact engagement metrics across markets. These datasets reveal that platforms emphasizing early exposure of newly released titles within the first 48 hours achieve higher completion rates.
Another major finding involves content rotation frequency. Platforms that reorganize featured sections weekly retain attention more effectively than those with static layouts. Viewers respond positively to refreshed visual cues and contextual relevance, especially when genres align with current consumption patterns.
Engagement Behavior Snapshot:
| Engagement Factor | High Engagement Platforms | Low Engagement Platforms |
|---|---|---|
| Weekly Content Refresh | 18–22% | 6–9% |
| Average Viewing Session | 52–55 minutes | 30–33 minutes |
| Content Completion Rate | 67% | 39% |
| Viewer Return Frequency | 2.3 times weekly | 1.2 times weekly |
By leveraging Extract OTT Content Catalog Data, streaming services move beyond assumptions and rely on real user behavior to design experiences that sustain viewer interest and drive repeat engagement.
Evaluating Metrics That Influence Viewer Loyalty
Retention success is shaped by more than just content volume. Viewer loyalty is influenced by how efficiently platforms guide users toward relevant titles and how content performance evolves after release. Behavioral metrics such as rating velocity, genre stickiness, and discovery speed offer valuable insight into what keeps audiences engaged.
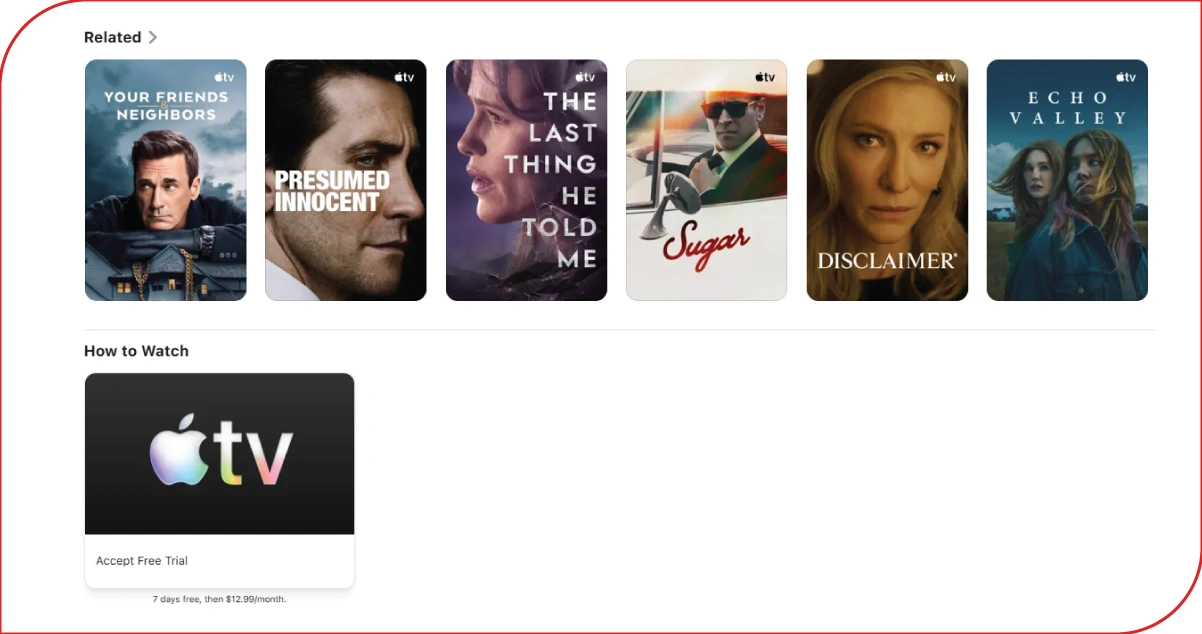
Through structured OTT Content Performance Analysis, platforms can assess how competitors optimize content visibility and maintain engagement beyond initial release windows. Scraped performance signals show that series with consistent engagement over three weeks tend to outperform high-traffic releases with rapid drop-offs. This distinction helps streaming brands prioritize sustainable content investments.
Metadata clarity and recommendation logic also play critical roles. Platforms that improve synopsis accuracy, genre tagging, and preview relevance reduce abandonment after the first episode. Data further reveals that balanced genre distribution prevents viewer fatigue and encourages exploration across categories.
Performance Indicator Comparison:
| Metric Evaluated | Strong Loyalty Platforms | Average Platforms |
|---|---|---|
| Viewer Retention After Episode One | 68–71% | 37–42% |
| Rating-to-View Ratio | 1:15 | 1:28 |
| Discovery Time | Under 36 hours | Over 72 hours |
| Genre Engagement Stability | 75–78% | 44–48% |
By leveraging Scrape Amazon Prime Video Data insights, streaming services move beyond short-term spikes to craft loyalty-driven strategies anchored in long-term performance indicators.
Comparative Library Structures Across Competing Platforms
A platform’s catalog structure strongly influences how audiences perceive value and variety. Rather than focusing solely on size, successful services maintain a balance between freshness, diversity, and relevance. Continuous analysis of competing libraries highlights how strategic catalog composition improves retention outcomes.
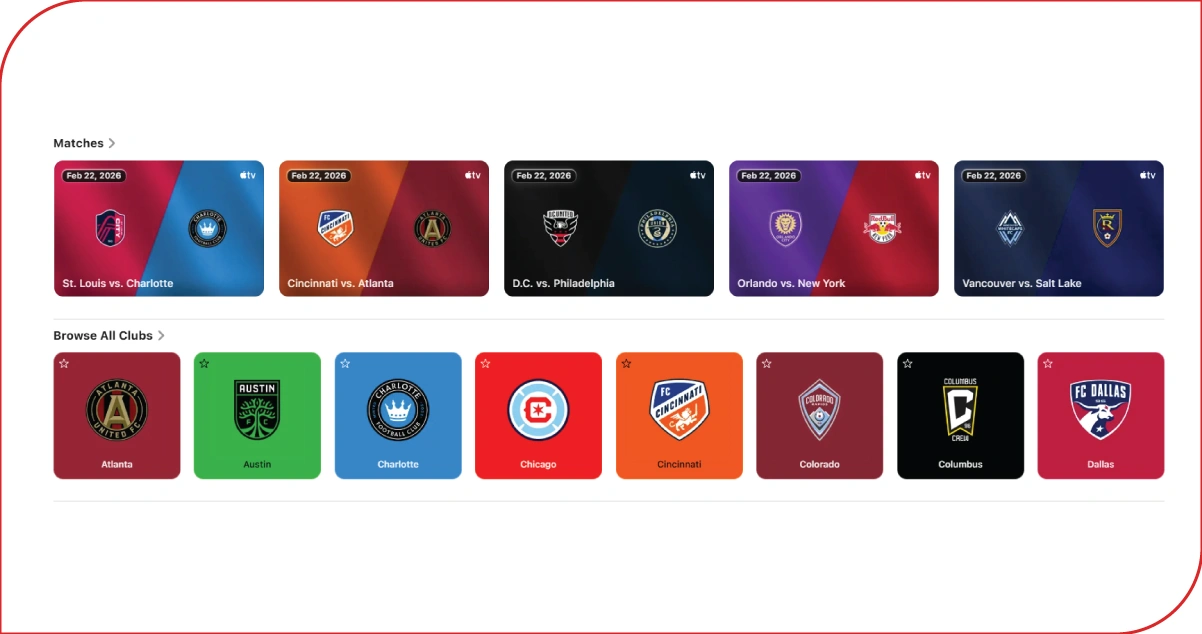
Using OTT Catalog Analysis Across Streaming Platforms, streaming services can track how competitors expand, rotate, and retire titles across genres and regions. Scraped catalog data shows that platforms maintaining a healthy mix of originals, licensed titles, and regional content perform significantly better than those overly reliant on a single category.
Another insight centers on catalog pruning. Removing underperforming titles improves recommendation accuracy and reduces content overload, helping users find relevant options faster. Platforms that actively manage their long-tail content see improved discovery rates and higher satisfaction scores.
Catalog Composition Insights:
| Catalog Attribute | Optimized Libraries | Underperforming Libraries |
|---|---|---|
| Original Content Share | 32–35% | 15–18% |
| Regional Content Mix | 27–30% | 10–13% |
| Monthly Title Rotation | 13–15% | 4–6% |
| Long-Tail Utilization | 40–43% | 18–22% |
Rather than expanding blindly, catalog intelligence powered by the ability to Scrape Disney+ Content Metadata enables streaming services to curate libraries that enhance discovery, boost engagement, and foster long-term viewer loyalty.
How OTT Scrape Can Help You?
Strategic streaming decisions rely on visibility, accuracy, and timing rather than assumptions. By integrating OTT Competitor Analysis Using Data Scraping, platforms gain real-time clarity into how competitors adjust content, engagement strategies, and catalog positioning across markets.
How we supports smarter decisions:
- Continuous tracking of competitor content updates.
- Early identification of trending genres and formats.
- Performance benchmarking across regions and devices.
- Audience behavior mapping using real engagement signals.
- Actionable insights for release scheduling optimization.
- Scalable intelligence pipelines for evolving OTT needs.
In addition to competitive visibility, our solutions enable platforms to Extract OTT Content Catalog Data with structured accuracy, supporting smarter programming, acquisition prioritization, and long-term viewer retention strategies.
Conclusion
Streaming growth today depends on how precisely platforms interpret competitive signals rather than how quickly they expand libraries. When applied correctly, OTT Competitor Analysis Using Data Scraping transforms raw competitor activity into clear retention-focused strategies, allowing platforms to design experiences viewers consistently return to.
By combining intelligence frameworks to Scrape Amazon Prime Video Data with tailored analytics models, OTT brands can refine content decisions with confidence. Ready to improve retention outcomes and outpace competitors? Connect with OTT Scrape today to turn competitor data into measurable viewer loyalty.